
Speed/Power Development

David J. Szymanski, PhD
Department Chair & Professor
Louisiana Tech University
Ruston, Louisiana, United States
Mu Qiao, PhD
Assistant Professor
Louisiana Tech University
Ruston, Louisiana, United States
Tyler Krobetzky
Graduate Student
Louisiana Tech University
Ruston, Louisiana, United States
Jessica M. Szymanski
Instructor
Louisiana Tech University
Ruston, Louisiana, United States
.jpeg.jpg "Ryan L. Crotin, PhD photo")
Ryan L. Crotin, PhD
Adjunct Faculty
Louisiana Tech University
Ruston, Louisiana, United States
We would like to thank the baseball position players and coaching staff at Louisiana Tech University for being involved in this project.
Introduction: Bat velocity (BV) and batted-ball exit velocity (BEV) are offensive baseball-specific attributes that are important to on-field hitting performance. Increased BV will allow for increased decision time, decreased swing time, and increased BEV. If the baseball is hit off the sweet spot of the bat, increased BEV will result in the baseball being hit harder, farther, or both.
Purpose: To determine which lab and field tests correlate to maximum and mean BV and BEV for collegiate baseball players.
Methods: Twenty-seven Division I college baseball players (age = 20.2 ± 1.4 years, height = 181.2 ± 5.2 cm, body mass = 86.0 ± 9.7 kg, lean body mass = 75.0 ± 6.2 kg, BMI = 26.1± 2.2 kg·m-2, percent body fat = 12.5 ± 3.7%) volunteered for this study. Tests included anthropometrics and body composition as well as absolute strength tests for dominant and non-dominant hand grip, one repetition maximum (1RM) parallel squat, barbell bench press, and 1-arm landmine row. Absolute power tests included a 1.8 kg (4 lb) overhead medicine ball throw and 0.9 kg (2 lb) medicine ball rotational hitters throw for velocity, as well as standing long jump (SLJ) and estimation of SLJ peak power (PP), drive (D) and stride (S) leg lateral-to-medial jump, bilateral vertical jump (VJ), bilateral estimation of VJPP, actual bilateral VJPP, unilateral vertical jump from the D and S leg, and unilateral VJPP from the D and S legs. Relative values for all tests were calculated based on the strength and power values divided by the athlete’s body mass and lean body mass (LBM). The maximum and mean BV and BEV from 10 baseballs hit from a batting tee into a catch net were recorded in a batting cage. All of these variables were recorded during the offseason and were correlated with one another by using a correlation matrix from raw data scores. The critical r value for Pearson product-moment correlation coefficient was 0.381 with an alpha level of 0.05.
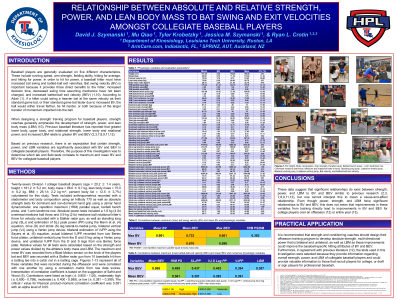
Results: Statistical analysis indicated significant high positive relationship (p < 0.05) between maximum BV and mean BV (r = 0.961). There were significant moderately high positive relationships between maximum BV and mean BEV (r = 0.733) and maximum BEV (r = 0.661); mean BV and mean BEV (r = 0.676). There were significant moderate positive relationships between maximum BEV and the following variables; mean BV (r = 0.598), 1RM squat (r = 0.489), SLJPP (r = 0.437), and VJ D leg PP (r = 0.402). There was also a significant moderate positive relationship between mean BEV and 1RM squat (r = 0.501). There were significant low positive relationships between maximum BEV and VJPP (r = 0.394) and LBM (r = 0.387); mean BEV and VJ D leg PP (r = 0.393), VJPP (r = 0.391), and SLJPP (r = 0.381); maximum BV and relative 1RM squat to body mass ratio (r = 0.382).
Conclusions: These data suggest that significant relationships do exist between strength, power, and LBM to BV and BEV, but one cannot interpret this to mean a cause-and-effect relationship. PRACTICAL APPLICATIONS: It is recommended that strength and conditioning coaches should design their offseason training program to develop absolute strength, multi-directional power that is bilateral and unilateral, as well as LBM as these improvements could improve the baseball-specific hitting attributes of BV and BEV.
Acknowledgements: