
Speed/Power Development

Nicolas M. Philipp, MS
PhD Student
University of Kansas
Lawrence, Kansas, United States
Derek Crawford
Assistant Professor
University of Central Missouri
Warrensburg, Missouri, United States

Dimitrije Cabarkapa, PhD, CSCS*D, NSCA-CPT*D, USAW
Director of Basketball Research
Jayhawk Athletic Performance Laboratory - University of Kansas
Lawrence, Kansas, United States

Andrew C. Fry, PhD, CSCS*D, FNSCA*E
Director, Jayhawk Athletic Performance Laboratory
University of Kansas
Lawrence, Kansas, United States
Lower body strength and power are commonly measured performance qualities across a number of sports. In recent years attention has been given to relationships, primarily between lower body strength and linear speed performance. While still limited, evidence is in agreement that lower body strength positively contributes to linear speed performance. However, what is less well understood is if there comes a point in an athlete’s development at which further increases in maximal strength may not fully compliment additional gains in speed performance.
Purpose: Within this study, authors aimed to provide practitioners with lower body strength and power thresholds that can discriminate between slow and fast performers within a group of collegiate American football players.
Methods: The performance analysis was conducted on preexisting data sets, which included strength and power assessments as well as 40-yard dash linear sprint completion times within a NCAA Division II American football team. Of particular interest to this study was the relationship between relative squat and hang clean strength and linear sprint performance, as well as vertical jump height, broad jump distance, and 40-yard dash performance. To account for the effect of body weight on strength and sprint performance, the sample was further divided into a high and low body mass group using a median split. Logistic regression models, supplemented with receiver operator curve analyses (ROC) were utilized to identify optimal cut-off points (i.e., relative strength or power thresholds), discriminating between fast and slow performers.
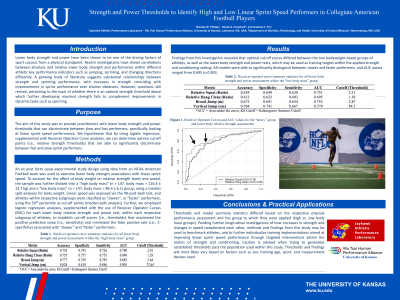
Results: Within the high body mass group, vertical jump performance (area under the curve (AUC) = 0.903 / Optimal Cut-Off = 72.6cm), broad jump performance (AUC = 0.883 / Optimal Cut-Off = 2.6m), and relative hang clean strength (AUC = 0.848 / Optimal Cut-Off = 1.28 * body mass) showed the highest predictive ability with regards to correctly classifying athletes into respective linear speed performance groups. Within the low body mass group, vertical jump performance (AUC = 0.779 / Optimal Cut-Off = 84.1cm), broad jump performance (AUC = 753 / Optimal Cut-Off = 2.6m), and relative squat strength (AUC = 0.74 / Optimal Cut-Off = 2.31 * body mass) showed the highest predictive ability with regards to correctly classifying athletes into respective linear speed performance groups.
Conclusion: Findings indicate that optimal cut-off scores differed between groups of athletes, as well as the strength and power tests. All models were able to significantly distinguish between slower and faster performers, and AUC values ranged from 0.695 to 0.903. Caution is advised when trying to generalize thresholds (i.e., cut-off points) past the population used within this study. Findings will most likely vary based on factors such as sex, training age, sport, and measurement devices used. PRACTICAL APPLICATIONS: Practitioners may apply findings from within this study when benchmarking athletes to further individualize their approach towards training for linear speed. Results in the high body mass group reflect proficiency within movements involving a rapid hip extension within the group of faster athletes. Strength and Conditioning Practitioners may find this insightful with regards to their selection of exercises enhancing such qualities. Within the low body mass group, the multifactorial nature of speed development is reflected within the lower AUC values.
Acknowledgements: N/A