
Biomechanics/Neuromuscular
 photo")
Lucy S. Kember, MSc (she/her/hers)
Senior Lecturer in Sports Rehabilitation
Cardiff Metropolitan University
Cardiff, Wales, United Kingdom

Rhodri S. Lloyd, PhD
Professor of Paediatric Strength and Conditioning
Cardiff Metropolitan University
Cardiff, Wales, United Kingdom
Gregory D. Myer
Professor
Emory Sport Performance and Research Center
Atlanta, Georgia, United States
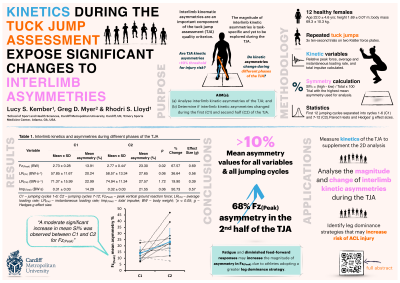
Purpose: The Tuck Jump Assessment (TJA) is traditionally used as a subjective screening method to visually assess for neuromuscular deficits associated with lower extremity injury. More recently, bilateral kinetics during the TJA have been reported (Kember et al., 2022). While the magnitude of interlimb asymmetries is task-specific and has been explored across various bilateral and unilateral tasks; interlimb asymmetries of (TJA) kinetics have yet to be reported and have not been quantified during different phases of the TJA protocol. The aim of this study was to (a) analyse the interlimb kinetic asymmetries of the TJA, and (b) determine if interlimb asymmetries changed during the first and second half of the TJA protocol.
Methods: 12 healthy female athletes (age 22.0 ± 4.6 yrs; height 1.69 ± 0.07 m; body mass 69.3 ± 10.3 kg) performed three ten-second trials of the TJA on two force plates, with asymmetries in relative peak force (FzPeak), average loading rate (LRAvg), instantaneous loading rate (LRIns), and total impulse (ImpTotal) extracted. As no reference value was required, interlimb asymmetries were quantified as a percentage difference using the symmetry index (SI %) with asymmetry values ~10% considered a potential threshold for heighted risk of injury (Bishop et al., 2018). The trial with the highest mean asymmetry across all jumping cycles was used for analysis, from which the first 12 jumping cycles were separated into cycles 1-6 (C1) and 7-12 (C2). Paired t-tests and Hedges’ g effect sizes (Hopkins et al., 2009) were used to determine the significance and magnitude of differences between C1 and C2.
Results: The mean SI% for all variables across all jumping cycles was greater than the predetermined threshold (FzPeak: 18.49 ± 5.82; LRAvg: 23.94 ± 6.56; LRIns: 25.30 ± 3.94; ImpTotal: 17.81 ± 6.84). A moderate significant increase in mean SI% was observed between C1 and C2 for Fz(Peak) (p = 0.026). For all other variables, differences between C1 and C2 were non-significant and small-to-moderate (Table 1).
Conclusions: Mean asymmetry values for all variables were >10% across all 12 jumping cycles. All variables surpassed this threshold during both C1 and C2, with a 67% significant increase in asymmetry observed for Fz(Peak). The data indicate that asymmetries >10% may be present during the TJA, with the significant changes in Fz(Peak) during the latter half of the test of most concern. Arguably, due to the nature of the repetitive rebounding task, fatigue and diminished feed-forward responses may increase the magnitude of asymmetry in Fz(Peak) due to athletes adopting a greater leg dominance strategy. PRACTICAL APPLICATIONS: Identifying the magnitude and change of interlimb asymmetries during different phases of the TJA could offer practitioners valuable insights into the presence of leg dominance landing strategies that may expose athletes to great risk of lower extremity injury.
Acknowledgements: None