
Biomechanics/Neuromuscular

Mary Claire Geneau, MSc, CSCS
PhD Student
La Trobe Univeristy
Coburg, Victoria, Australia
Paul Gastin
Professor
La Trobe University
Melbourne, Victoria, Australia

Lachlan James, PhD
Senior Lecturer
La Trobe University, Melbourne, Australia
Melbourne, VIC, Victoria, Australia
Purpose: With the and increased availability of strength assessment technology, sport scientists and practitioners are faced with high volumes of various strength-related data, which raises challenges for interpretation and application. To navigate these challenges, it is imperative that a classification process group data based on similar measures of strength. While expressions of strength have been classified several different ways in the literature, no consensus exists on how this classification process should be done. Furthermore, none of the current methods have applied a data-driven approach to empirically inform the classification process. Thus, the purpose of this study is to 1) empirically classify lower body strength domains, and 2) determine the most appropriate metric(s) for each domain of strength with the end goal of simplifying the strength diagnosis process for the end-user.
Methods: In a cross-sectional design, 63 male and female professional, semi-professional and recreational level athletes (age=20.3[2.2]yrs, hheight=167.9[6.8]cm, body mass (BM)=77.3[8.2]kg) completed the following strength tests: drop jumps (DJ) from 30, 45, and 60cm, squat jumps (SJ), countermovement jumps (CMJ), loaded (20-60% BM) CMJs, a 1-rep maximum back squat (1RM) and an isometric squat (ISQ) and isometric mid-thigh pull (IMTP) in both slow-ramp and rapid conditions. Each test apart from the 1RM was performed on portable force plates (ForceDecks Lite, VALD Performance, QLD, Australia) following best practice guidelines. Raw force-time data was analysed using VALD ForceDecks software, generating 169 force-time bilateral performance metrics. To determine the dimensionality of metrics derived from each test, a principal component analysis (PCA) was employed for each test (excluding 1 RM). The top 4 metrics contributing to each principal component were placed into a final PCA model.
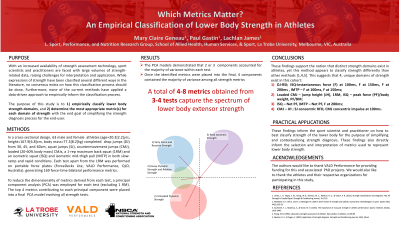
Results: The PCA models employed for each strength test demonstrated that 2 or 3 dimensions accounted for the majority of variance of each test. The final PCA model revealed that 4 principal components contained the majority of variance among all strength metrics, suggesting that 4, unique domains of strength exist in this cohort: 1) DJ-reactive strength index; ISQ-instantaneous force (F) at 100ms, F at 150ms, F at 200ms, IMTP – F at 100ms, F at 150ms; 2) Loaded CMJ – jump height (JH), 1RM, ISQ – peak force (PF)/body weight, PF/BM; 3) ISQ – Net PF, IMTP – Net PF, F at 200ms; 4) CMJ – JH; SJ concentric RFD, CMJ concentric impulse at 100ms.
Conclusions: These findings support the notion that distinct strength domains exist in athletes, yet this method appears to classify strength differently than other methods. Furthermore, these findings demonstrate that 1 or 2 metrics from each domain (dimension) contributed to the majority of variance within the respective domain. Thus, only a select number of tests (3-4) and metrics (4-8) are required to capture the spectrum of lower body extensor strength in athletes. PRACTICAL APPLICATIONS: These findings inform the sport scientist and practitioner on how to best select and interpret lower body strength assessments in athletes in an efficient and wholistic manner.
Acknowledgements: We would like to thank the athletes and coaching staff of Sandringham Dragons FC and Melbourne City FC for their participation in this study.