
Resistance Training/Periodization
.jpg "Jui Shah, MSc photo")
Jui Shah, MSc
Graduate student
Sacred Heart University
Bridgeport, Connecticut, United States
Tolga Kaya
Professor of Computer Science
Sacred Heart University
Fairfield, Connecticut, United States
Christopher B. Taber
Professor of Exercise Science
Sacred Heart University
Fairfield, Connecticut, United States
Understanding the physical demands of gameplay is a prerequisite for optimal training. There is less data available describing the physiological responses of female basketball players to gameplay. Typically, data is reported as heart rate (HR) and lactate responses due to games and practice with the team as a whole. PURPOSE: The purpose of this study is to assess the in-game demand and comparison between each position in a division 1 women’s basketball team.
Methods: Sixteen Division-1 female basketball players were analyzed for this study (Age: 21.0 ± 3 years; Height: 174.21 ± 19.27 cm; Body Mass: 73.98 ± 11.52 kg). Game metrics (distance, sprints, and accelerations) were calculated through the polar team pro system (Polar Team Pro, Polar Electro, Kempele, FI) sampling at 10 Hz. They were monitored during both Home and Away in-conference games. Six performance metrics were analysed: Total distance (m), Sprints (#) and Number of Acceleration across four zones {1[0.50-0.99 (m/s2)], 2[1.00-1.99 (m/s2)], 3[2.00-2.99 (m/s2)], and 4[3.00-50.00 (m/s2)]} Comparison was conducted on four main positions; Forward Guard (FG), Point Guard (PG), Shooting Guard (SG), and Center (C). Statistics were run with JASP (Version 0.17.1, Amsterdam, NL). A series of 1x4 (metric x position) one-way analysis of variance (ANOVA) was used to compare means across the four positions. If statistical significance was present a Bonferroni post hoc analysis was conducted to examine the differences. Statistical significance was set at p < 0.05.
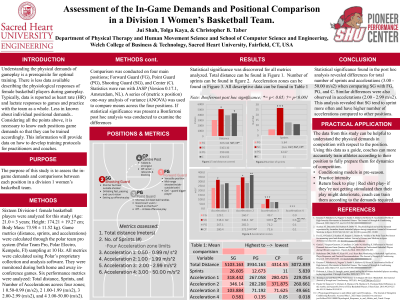
Results: Statistical significance was found for all metrics analyzed. Initial ANOVA results were as follows: Total Distance; F(3, 187) = 7.137, p < 0.001, Sprint; F(3, 187) = 18.913, p < 0.001, Number of accelerations Zone 1; F(3, 187) = 5.677, p < 0.001, Zone 2; F(3, 187) = 5.926, p < 0.001, Zone 3; F(3, 187) = 8.779, p < 0.001, and Zone 4; F(3, 187] = 9.634, p < 0.001. All post hoc positional comparisons can be found in Table 1.
Conclusions: Statistical significance found in the post hoc analysis revealed differences for total number of sprints and accelerations (3.00 - 50.00 m/s2) when comparing SG with FG, PG, and C. Similar differences were also observed in accelerations (2.00 - 2.99 m/s2). This analysis revealed that SG tend to sprint more often and have higher number of accelerations compared to other positions. PRACTICAL APPLICATIONS: The data from this study can be helpful to understand the physical demands in competition with respect to position. Using this data as a guide, coaches can more accurately train athletes according to their position to fully prepare them for dynamics of competition.
Acknowledgements: None