
Biomechanics/Neuromuscular

Cisco Reyes, PhD
Associate Professor
Linfield University
McMinnville, Oregon, United States
Historically, the primary metric identifying countermovement jump (CMJ) performance was jump height (JH). But now, with the advancement of sports technology, sports scientists and professionals can quantify the process and patterns behind an athlete’s CMJ JH output.
Purpose: the purpose of this study was to provide normative and profiling data of both the kinematics (output) and kinetics (process) of CMJ performances across a range of NCAA Division III student-athletes.
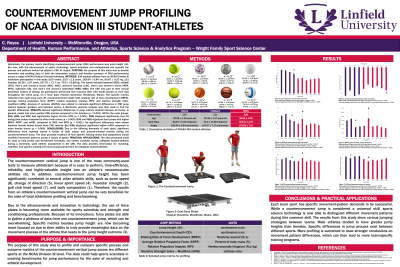
Methods: 236 student-athletes from an NCAA Division III institution participated in this study (105 males: 20.9 ± 1.5 years, 183.64 ± 6.84 cm, 80.87 ± 9.33 kg; 131 females: 20.38 ± 1.07 years, 167.67 ± 7.17 cm, 70.2 ± 13.88 kg). The teams included baseball (BSB), softball (SFB), men’s and women’s soccer (MSC, WSC), women’s lacrosse (LAX), men’s and women’s tennis (MTN, WTN), volleyball (VB), and men’s and women’s basketball (WBB, MBB). The CMJ was part of their annual preseason battery of testing. All participants performed four maximal CMJ, with hands placed on their hips throughout the entire jump, on a force plate (Hawkin Dynamics, Westbrook, Maine). The specific metrics collected from each jump were JH, countermovement depth (CD), braking rate of force development (BRFD), average relative propulsive force (ARPF), relative propulsive impulse (RPI), and reactive strength index-modified (mRSI). Analysis of variance (ANOVA) was utilized to calculate significant differences in CMJ jump metrics between genders, and between teams. A Bonferroni post-hoc analysis was then used to find the specific differences.
Results: Several significant differences in jump metrics resulted between all teams. In general, males had more positive CMJ metrics compared to the females (p < 0.001). Within the male groups, BSB, MBB, and MSC had significantly higher JH than MTN (p < 0.001). MBB displayed significantly less CD during their jumps compared to other male teams (p < 0.005). BSB and MBB organized their jumps with higher BRFD, ARPF, and mRSI, compared to MSC and MTN (p < 0.001). No significant differences were shown between female teams across most CMJ metrics. But WBB displayed significant higher mRSI compared to other female teams (p < 0.006).
Conclusions: Due to the differing demands of each sport, significant differences were reported across a variety of both output and process-oriented metrics during the countermovement jump. The data provided evidence of how specific training stress and adaptations create modified movement patterns across a variety of sports. PRACTICAL APPLICATIONS: The data presented could be used to help profile and benchmark kinematic and kinetic variables across collegiate student-athletes during a commonly used athletic assessment in the CMJ. The data provides information for recruiting and retention, as well as driving specific training and return-to-play parameters to better the health and performance of collegiate student-athletes.
Acknowledgements: None