
Endurance Training/Cardiorespiratory
 photo")
Junhai Xu, PhD (he/him/his)
Assistant professor
Louisiana Tech University
Ruston, Louisiana, United States

David J. Szymanski, PhD
Department Chair & Professor
Louisiana Tech University
Ruston, Louisiana, United States
Vishesh Singh
Instructor
Louisiana Tech University
Ruston, Louisiana, United States
Jessica M. Szymanski
Instructor
Louisiana Tech University
Ruston, Louisiana, United States
.jpeg.jpg "Ryan L. Crotin, PhD photo")
Ryan L. Crotin, PhD
Adjunct Faculty
Louisiana Tech University
Ruston, Louisiana, United States
Baseball pitching is considered a high intensity, short duration task repeated numerous times during a game. Training specificity is a priority for a well-designed conditioning program as it should be individualized to the pitcher and include a wide range of fitness intensities. Previous studies have used percent of heart rate maximum (HRmax) to monitor exercise intensity; however, few have used oxygen uptake (VO2) to assess pitching intensity.
Purpose: To determine exercise intensity of baseball pitching during a 2-inning bullpen session compared to VO2max, estimated VO2max, and HRmax.
Methods: Fourteen Division I college baseball pitchers (age = 21.21 ± 1.66 years, height = 184.49 ± 6.35 cm, body mass = 89.10 ± 9.84 kg, percent body fat = 13.37 ± 4.25%, BMI = 26.22 ± 2.66 kg·m-2) volunteered to participate in this study. Each pitcher completed a 1.5-mile run to estimate VO2max, a treadmill VO2max test, and a 2-inning bullpen (pitching session) in a lab setting during the offseason. Before the 2-inning bullpen session, each pitcher completed a 30-minute warm-up and standardized throwing program. Then pitchers wore a portable gas analyzer and HR monitor to record VO2 and HR values during the whole session. After 10 minutes rest, each pitcher completed the same testing procedure, which included 7 warm-up throws from a pitching mound, followed by throwing a standardized 16-pitch routine which represented the 1st inning (6 min). Then pitchers rested for 6 minutes, which represented being in the dugout during the team’s offensive half inning. Then pitchers began the 2nd inning of pitching using the same sequence of events as the 1st inning. Once the 2nd inning was completed, pitchers rested for 6 minutes. All VO2 data were normalized to each pitcher’s VO2max (%VO2max) and estimated VO2max (% estimate VO2max). Heart Rate data was normalized to each pitcher’s % HRmax. To compare the intensity between the two innings, paired sample t-tests were run. An alpha level of p ≤ 0.05 indicated significance.
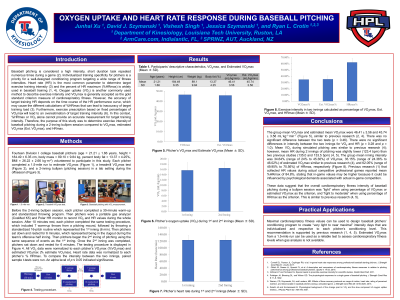
Results: The group mean VO2max and estimated mean VO2max were 46.41 ± 3.56 and 45.74 ± 3.58 mL·kg-1·min-1, respectively. There was no significant difference between the two tests (p = 0.46). The group mean inning intensity was 34.64% (range of 24% to 45.36%) of VO2max, 35.15% (range of 24.36% to 46.02%) of estimated VO2max, and 62.05% (range of 49.95% to 75.56%) of HRmax, respectively. There were no significant differences in intensity between the two innings for VO2 and HR (p = 0.28 and p = 1.0).
Conclusions: These data suggest that the overall cardiorespiratory fitness intensity of baseball pitching during a bullpen session was “light” when using percentage of VO2max or estimated VO2max as the criterion, and “light to moderate” when using percentage of HRmax as the criterion. PRACTICAL APPLICATIONS: Maximal cardiorespiratory fitness values can be used to design baseball pitchers’ conditioning program to create “very light to near maximal” intensity days that are individualized and respective to each pitcher’s conditioning level. Estimated VO2max from a 1.5-mile run can be used as a reliable test to assess cardiorespiratory fitness levels when gas analysis is not available.
Acknowledgements: The authors acknowledge the support of the pitchers participated in the study and the coaches and staff of Louisiana Tech University baseball team. No authors declare any conflict of interest.