
Tactical Strength and Conditioning
 photo")
Baylee S. Techmanski, MS CSCS (she/her/hers)
Strength and Conditioning Coach
Athlete Performance
Waukesha, Wisconsin, United States
Cameron Kissick
Sport Science Associate
NY Mets
Port St. Lucie, Florida, United States

Paul Comfort, PhD, CSCS*D
Professor
Univeristy of Salford
Salford, England, United Kingdom

J. Bryan Mann, PhD
Associate Professor
Texas A&M University
Miami, Florida, United States

Timothy J. Suchomel, Phd, CSCS*D, RSCC
Associate Professor
Carroll University
Waukesha, Wisconsin, United States
Purpose: To examine the differences between system and barbell velocity during the jump shrug (JS) and hang high pull (HHP) performed across a spectrum of loads.
Methods: 15 resistance-trained men (age: 25.5±4.5 years, height: 176.1±8.5 cm, body mass: 88.3±15.4 kg, relative one repetition maximum hang power clean (1RM HPC): 1.3±0.2 kg/kg) familiar with the HPC and its derivatives participated in three testing sessions. The first session involved performing a 1RM HPC while the following two sessions involved performing three repetitions each of the JS or HHP with loads of 20, 40, 60, 80, and 100% of their 1RM HPC. Each JS and HHP was performed on a force platform with a linear position transducer attached to the barbell. The force-time data were used to calculate system (subject+load) mean and peak velocity during the concentric phase of the movement using a forward dynamics approach. The displacement-time data from the linear position transducer was used to determine mean and peak barbell velocity during each JS and HHP repetition. The average system and barbell velocities across trials were used for comparison at each load. Two, 2x5 repeated measures ANOVA tests were used to determine the effect of the velocity measure and load on mean and peak velocity during the JS and HHP. In addition, Hedge’s g effect sizes were used to determine the magnitude of difference between system and barbell velocities at each load.
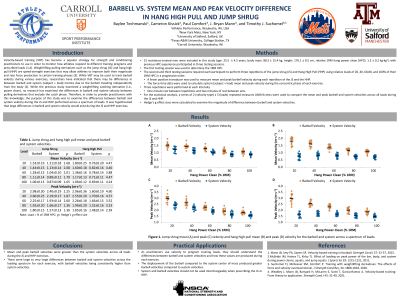
Results: The mean and peak system and barbell velocities achieved at each load during the JS and HPP are displayed in Table 1. There were significant main effects (p< 0.001) for the velocity measure and load as well as velocity measure x load interaction for the JS and HHP. Barbell velocity was significantly greater (p< 0.001) than system velocity across all loads during both the JS and HHP. The differences between system and barbell velocity during the JS ranged from large to very large for mean (g=1.65-2.08) and peak velocity (g=1.36-2.25). In addition, the differences between system and barbell velocity during the HHP were very large for mean velocity (g=3.88-4.47) and peak velocity (g=2.39-4.60).
Conclusions: Mean and peak barbell velocities were greater than the system velocities across all loads during the JS and HHP exercises. There were large to very large differences between system and barbell velocities across the loading spectrum for each exercise, with barbell velocities being consistently higher than system velocities. PRACTICAL APPLICATIONS: When using velocity bands to program training loads, it is important that practitioners understand the differences between system and barbell velocities and how these values are produced during each exercise. The displacement of the barbell compared to the system center of mass produced the greater barbell velocities compared to system velocities. System and barbell velocities should not be used interchangeably when prescribing the JS or HHP.